3 Seasons of Dejan Lovren: Part One

What is there left to say about Dejan Lovren? Depending on who you talk to (or perhaps when you asked them), he is either a commanding and organised centre back, capable of perhaps one day captaining his new club Liverpool, or one of the biggest defensive transfer flops in Premier League history, the man at the heart of everything wrong with Liverpool’s back line this season.

The rise and subsequent plummet of Lovren’s reputation in England is really interesting to me, and I think it speaks a lot more for the argument that it is important to assess the defensive setup of a team as a whole before committing to spending big money on just one link in that defence. You wouldn’t put a slow, cumbersome forward up top for a team playing fast technical football, so why wouldn’t you profile your defenders in the same way?

This isn’t to suggest that Liverpool haven’t done their homework- I’m absolutely certain they have, with a statistical approach far superior to what I could achieve here, and with a level of information us bloggers can only imagine. What I want to understand is how Dejan Lovren performed in the context of the systems being used at his previous clubs, Lyon in 2012/13 and Southampton in 2013/14. Are there systematic differences in the way these teams were set up that can account for why he looked so great at Southampton and so poor at Liverpool?

In this first post, I’ll look at his final season at Lyon.

Lovren at Lyon: 2012/13

Under reported interest from Chelsea, a 20 year-old Lovren signed for Lyon back in 2010 for roughly £7.5 million. Shunted around the back four and often left benched, a reputation quickly developed of an unreliable defender, prone to costly errors and severely lacking in discipline; he was sent off an astonishing 7 times for Lyon, including 3 times in his final season.

In this final season, Lovren was first choice when fit for the most part. He played at left sided centre-back, establishing a partnership with newly signed Serb Milan Bisevac, a defender with plenty of Ligue 1 experience.

Lyon can broadly be described as playing a 4-2-3-1, with Maxime Gonalons sitting in front of the defence and Steed Malbranque playing box-to-box. Lisandro Lopez and Alexandre Lacazette appeared on either wing, with Clement Grenier playing at No. 10 behind Bafetimbi Gomis. Lyon spent much of the season near the top of the table, but fell away badly in March, losing 3 matches in a row, and eventually finishing 3rd.
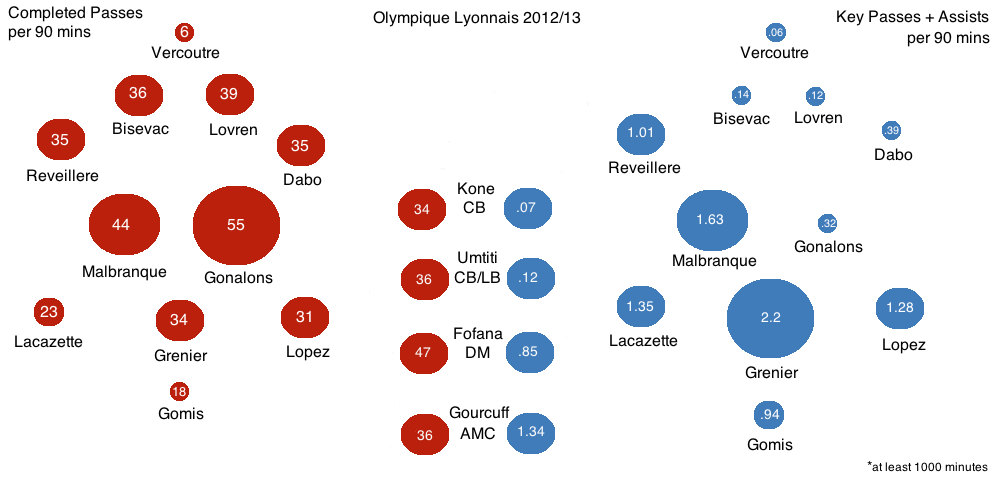
LyonMost of the passing seems to go through Malbranque, Gonalons, and Grenier, with neither Anthony Reveillere nor Mouhamadou Dabo hugely involved from full-back. In terms of generating shots, Lyon’s right hand side is more active than the left, geared around getting the ball to Gomis in the box. Lopez also played up front at times, weighing in with 11 league goals to Gomis’ 16. Goalkeeper Remy Vercoutre appears to have bypassed the central defence with much of his passing, recording 13 long balls for every 3 shorter passes per 90 minutes.

So, what can we learn about Lovren from these figures? For me, two things really jumped out. Firstly, Lyon always had at least one deep-lying midfielder hanging around in front of Lovren and Bisevac. Gonalons was pretty much constant throughout the season and, as I’ll show in a moment, did a great deal of defensive work. Steed Malbranque was enjoying an unlikely revival as an all action midfielder next to him, weighing in defensively as well as helping Lyon create chances. Gueida Fofana, another defensive midfielder, often appeared alongside Gonalons, meaning the Lyon midfield did plenty of defensive work shielding Lovren and Bisevac. Secondly, Lovren’s regular fullbacks (typically Mahamadou Dabo but sometimes Samuel Umtiti) were both fairly conservative, not hugely involved in attacking play.

What about in terms of defensive actions? Where does this team win the ball back, either through tackles or interceptions?

lyondef

These figures help to clarify Gonalons’ role- he was by far the greatest contributor in terms of tackles and interceptions and rarely got himself up the pitch in a creative capacity (17 shots, 11 key passes and 0 assists all season). Lovren and Bisevac were thus pretty well shielded, each making just 1 tackle per game.

One very important thing these stats don’t tell us is how Lovren positioned himself during opposition attacks. His role at Southampton as an organiser, cajoling Jose Fonte and urging his full-backs up the pitch, is rarely in evidence whilst watching footage of Lyon in 2012/13.

I’ve watched this attack develop a dozen or so times, and each time I’m left a little more baffled by Lovren’s decision making.

Screen Shot 2015-01-03 at 09.05.08 (2)

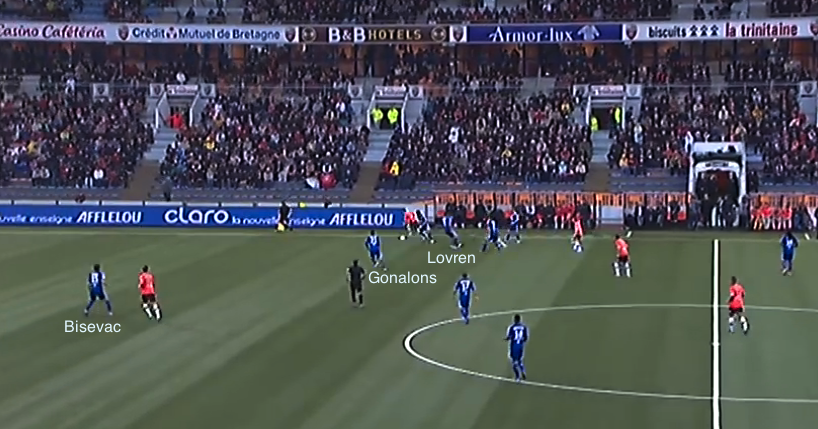
First of all, this shouldn’t be a dangerous situation. Lorient are in possession with two attackers completely surrounded on the right flank by Monzon, Lovren’s fullback, Gonalons, and Grenier. There is no need for Lovren to get sucked in like this, and he leaves Bisevac completely isolated.

Screen Shot 2015-01-03 at 09.07.28 (2)

Now Lyon are in trouble. Monzon and Lovren have both moved towards the ball even further, and Lorient break down the right. At this point, Lovren has essentially put himself out of the game. Bisevac is perhaps at fault for not sticking to Aliadiere tightly, but he has to move across in case Monzon gets dribbled past.

A complete lack of communication with Umtiti in this example means Lovren does not even attempt to challenge for the header, presumably assuming Umtiti will go for it instead.

And from the same game (skip to 2.10), Lovren is about 5 metres further forward than Bisevac, and then gives away a penalty.

Skip to 2.07 in that last video, and see if you can see Lovren as Nice attack. He’s certainly not at centre-back, next to Bisevac, where he should be…

Screen Shot 2015-01-03 at 12.22.47 (2)

That’s because Lovren has rushed ten years ahead of his defensive line to attempt to win the ball back. Dabo has moved centrally to mark the guy who should be Lovren’s responsibility. When Lovren fails to make the tackle, he turns around, but still doesn’t seem to realise just how far he is from Bisevac.

Screen Shot 2015-01-03 at 12.27.54 (2)

Dabo has gone to intercept the cross, leaving the guy he was marking completely free in the box- Lovren makes no effort to get back into shape, and luckily for Lyon the shot is pretty much straight at Vercoutre. Watch the next highlight too- Lovren completely ignores the fact that Cvitanich, Ligue Un’s joint 2nd top scorer at the time, has just pulled off his shoulder- he is ball watching again. At 3.20, on a yellow, he dives in to a challenge fully 50 yards from his own goal and gets sent off.

There are also some noticeable examples of Lyon being completely undone at the back by speculative or aimless balls from deep towards Lovren’s side.

(skip to 1.34 for that last video)

When I watch these three clips in particular I recognise the Lovren we sometimes see at Liverpool- struggling one versus one and a certain level of panic around his game, which results in poor decision making.

The Lovren we see at Lyon is a proactive defender- he seems to prefer moving towards the ball whenever possible. When this comes off, it looks great- a centre-back racing out of defence to win the ball in midfield. When it doesn’t work, however, a huge gap is left behind Lovren, and his lack of communication with his full-back and with his centre-back partner Bisevac is often noticeable. Whether what we see here is the naivety of a young centre-back, or an inherently poor reader of the game, is more difficult to determine. It is a very stark contrast from what we saw the following season at Southampton, where Lovren was always pointing and shouting to his teammates. The stats suggested that Gonalons was a big contributor defensively, and its probably no coincidence that some of Lovren’s poorer moments appear to have come when Gonalons had been completely bypassed.

Lovren has spoken in the past about how his confidence was low at Lyon- he struggled to settle in at first, finding the language barrier particularly difficult to deal with. He speaks about the pressure the fans put upon him because of his high fee, and the idea that referees had typecast him as a dangerous and reckless tackler. Whether this is really true or not doesn’t matter, but it certainly suggests to me that Lovren is something of a confidence player, who cares deeply how he is perceived. It often seems to be the case in football that mistakes compound one another, and indeed a series of bad mistakes cost Lovren his place towards the end of 2012/13, the final straw being that goal conceded against Sochaux.

Anyway, more on this in a few days, when I’ll take a look at Lovren’s next season at Southampton.

Follow One Man Club on Twitter

A Look at Both Teams to Score in Both Halves Data

Most bookmakers offer a tempting line, generally between 14/1 and 30/1, on both teams to score in both halves (hereafter BTTSBH) in a given game. Given the generous odds on offer, I wanted to take a look at how often this occurs, and what factors may be important, using fairly simple data from football-data.co.uk.

I’ve used information from the Premier League, from 1995/96 up to but not including this latest round of fixtures (beginning October 25th). This gives 7300 matches for us to look at.

Out of these 7300 matches, BTTSBH occurred 375 times, or in roughly 5% of the total matches. Based on this very basic stat, the odds should be around 20/1.

Lets split this up by season. How stable is this 5% figure?

SeasonNot that stable- the highest number of BTTSBH occurrences was 30 in 2003/04 (7.9%), with the lowest at just 13 in 2086/09 (2.9%).Below shows the fluctuations in %.

Percentage

I’ve included data from 2014/15, hence the large % of BTTSBH occurrences this season. After 80 matches of this season, there had been 10 of these matches, accounting for 12%. This is unusual within this sample of seasons, and I will return to this later.

Are there any teams who are particularly likely to be involved in these matches? The chart below shows all teams who have spent 5 or more seasons in the Premier League since 1995/96, with the bars representing the total BTTSBH occurrences each team has been involved in, divided by number of seasons. So, in essence, the number of BTTSBH occurrences per season.

TeamsOf the current Premier League teams, Stoke appear marginally more likely at 0.8 over 7 seasons, with Sunderland pretty high too. Birmingham averaged one BTTSBH occurrence in each of their 7 seasons in the Premier League. The differences on show here aren’t really that great though.

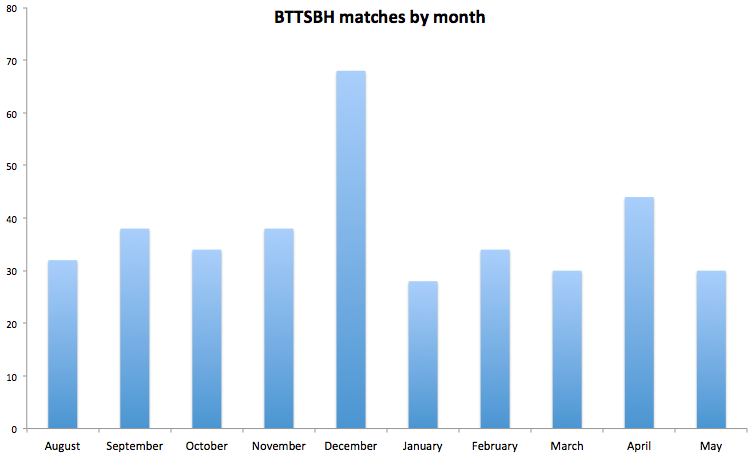
Finally, is there a particular time of year when these types of matches my be more likely to occur? I had a theory that they may be more likely on the opening day, and the final day, of the season, and wanted to check. Here are the total number of BTTSBH occurrences by month.

Month

Everything is within a pretty similar range here, bar two months. The first is December, where historically there have been double as many BTTSBH matches as in August, October, January, February, March, and May. The second is April, but the increase isn’t that great compared to December.

Whilst it doesn’t appear that any particular team has been historically more likely to take part in these types of matches, there may be some factors that influence teams to score and concede more freely around December. Given the close proximity of games around the Christmas period (a team can play 3 games in 7 days around this time), it may be that this leaves teams more open at the back, resulting in more of these BTTSBH matches. A team will typically play more games in December, so you would expect the rate to be a little higher compared to other months, but probably not quite this high.

Its also worth pointing out that at this point in the season, there have usually been on average 4 BTTSBH matches, based on our sample. As mentioned earlier, there have been 10 already this season. Whether this reflects some broader trend, or whether we will see a great deal of regression to the mean, remains to be seen.

So, if you’re going to take up these odds at any time, it may be worth taking a look at the fixtures around Christmas, and chance your hand. With the odds around 20/1, its definitely worth a try, and this season may be the season to do it.


Why San Marino Probably Aren’t the Worst National Team in the World

San Marino are routinely described as ‘the worst team in international football’. They sit at the bottom of the FIFA rankings, have won 3 times in their entire history, often lose by 5 or more goals, and have scored 19 times since 1990.

OK, so they are plainly not a great side. Here is their ranking over the time since the rankings were introduced in 1993.

Screen Shot 2014-10-10 at 15.54.23

Sam Wallace of the Independent argued that this actually shows a decline in San Marino’s abilities. This is plainly misrepresentative, as any cursory look at San Marino’s historical lack of good results would indicate- it isn’t as if San Marino started out any better than they are now. This ‘decline’, I will argue, is solely due to geographical factors.

San Marino rarely play friendlies (at least not those recognised by FIFA). Their only matches come in European Championship and World Cup qualifiers. As the lowest ranked team in Europe, this always pits them against vastly superior opponents. The lowest ranked team San Marino have played competitively is Malta (currently 155th), and the average current ranking of their last 20 opponents is 54th, where Hungary currently sit.

Compare this to the other lowest ranked teams from different federations. Djibouti’s toughest opponent in the last 20 fixtures was Egypt (61st currently), Anguilla’s was El Salvador (72nd), and Bhutan’s most difficult game in its history was against the Philippines (currently 134th). Below is the average current ranking of these team’s opponents in the last 20 fixtures.

Screen Shot 2014-10-10 at 15.55.58

There are only 10 European sides outside the top 100, and due to the way competitive group draws are seeded, San Marino are unlikely to play most of these. So, San Marino are stuck playing some of the best teams in the world, and the opportunity to win isn’t coming any time soon.

San Marino are probably the worst team in Europe, a small fish in a very big pond. But to claim they are the worst in the world is to fail to recognise the strength of their opponents compared to rest of the bottom 50 or so nations. San Marino don’t get to play Turks and Caicos Islands, or Rwanda, or Fiji- they play Romania, or England, or, if they are incredibly lucky, a team like Malta.At least nations from other federations get to play fellow minnows.

So, are San Marino better than Bhutan, or the Cook Islands, or any of the other teams right at the bottom? We don’t know. These teams will probably never play each other, so all we have to go on are the rankings, which are at least objective.

On the Productivity of Manchester United’s Academy: A Comparison

There’s been a great deal of handwringing from various media figures this summer about a perception of Manchester United supposedly departing from their usual philosophy. The ‘Manchester United way’, we are told, is to eschew big money purchases of ready made players, instead focusing on developing talent, with an emphasis on their famous academy. This has been rumbling on all summer, but really reached a peak with United shipping out Manchester born Danny Welbeck for one season of Radamel Falcao on deadline day.

“For so long the standard-bearers of youth football, Manchester United are now just another big corporation in the market.” (Mark Payne, ESPN).

“There was a place for him and I am not too pleased he’s gone to Arsenal. It is sending out the wrong message when local home grown players like that are leaving.” (Eric Harrison, former United coach).

And perhaps most dramatic of all:

“What will happen in the future now, nobody knows, but that thread has been broken now.” (Mike Phelan, former assistant manager).

This all ties in with the recent debates over the lack of young English players breaking through at top clubs, and arguments over the way clubs should be run in terms of their recruitment strategies. These are much bigger debates than I can hope to address, so I will skip over both issues.

I reacted to this outcry with some scepticism- traditionally United’s academy has been very strong, but I couldn’t recall too many players it had pushed through in recent years- Wes Brown, John O’Shea, and Darren Fletcher were the only ones who immediately sprung to mind in addition to Welbeck. This, I thought, was a bit meagre, and I sent an ill-informed and hasty tweet in reaction.

I wanted to compare the productivity of United’s academy to other top English clubs, to determine whether this initial opinion was right. I chose Arsenal and Liverpool for this comparison, as all three are clubs traditionally challenging for at least the top 4 over the course of the Premier League era.

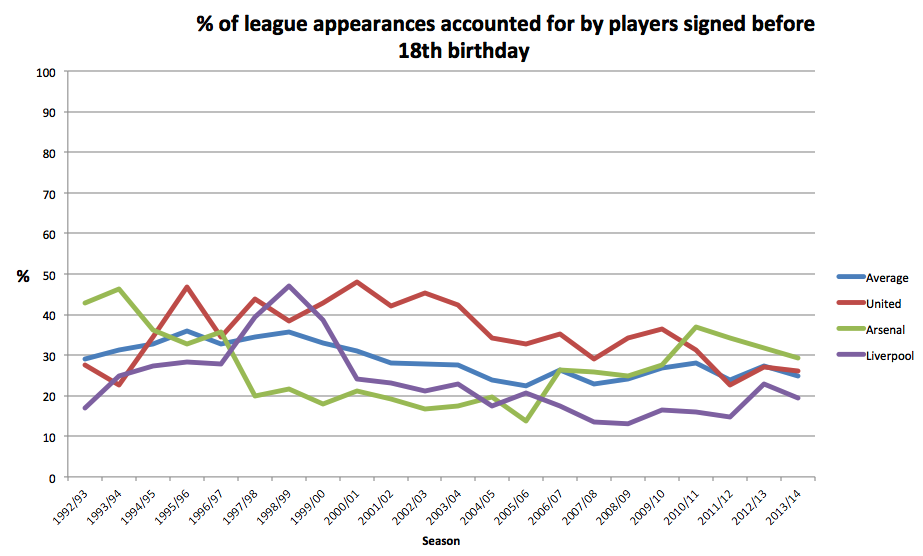
I looked at every season from 1992/93 until 2013/14, totalling all appearances by all players for each of the 3 clubs in the league for any one season. I then worked out what percentage of these total appearances were accounted for by players signed before their 18th birthday (so, in essence, how much playing time did these players get over the season, expressed as a percentage). I chose to include players signed at 17 or younger because the vast majority of these players have not made their debut for another club, were not signed for the first team, and still represented some kind of ‘gamble’, where academy coaching would be needed to realise their potential. There are exceptions to this, which I will address a little later.

First, an average of these figures for all 3 clubs, by season:

Screen Shot 2014-09-07 at 10.00.21 (2)I had actually expected a sharper decline, but its quite steady between 20% and 30% for the last decade, with a greater number before 2000 as foreign players became more commonplace.

Do United better this average?

Screen Shot 2014-09-07 at 10.04.51 (2) Indeed they do, and the difference is pretty great for the most part. What we are largely seeing in this figure is the influence of the ‘Class of ‘92’, including David Beckham, Gary and Phil Neville, Ryan Giggs, Nicky Butt, and Paul Scholes. None of these players remain, however, and United have moved closer to the average in the past 4 seasons. At the peak, in 2000/01, 48% of all appearances came from players signed before their 18th birthday. That’s a lot. This includes players such as Wes Brown (28 apps), Ronnie Wallwork (12 apps), and Luke Chadwick (16 apps), as well as a relatively injury free season for all of the players mentioned above.

How do Arsenal and Liverpool do?

Screen Shot 2014-09-07 at 10.08.27 (2)Liverpool nearly hit 50% in 1998/99, with Jamie Carragher, Michael Owen, Steven Gerrard, Robbie Fowler, and Steve McManaman featuring heavily among others, and these players contributed to Liverpool’s jump above the average for 3 seasons. Largely they’ve been operating below the average, but have been pushed up by the likes of Jon Flanagan and Raheem Sterling more recently.

Arsenal have largely placed below the average too, since just before Wenger’s tenure began. They have seen an increase in more recent years too though-bettering the average since 2007/08. Whilst the development of players such as Jack Wilshere, Wojciech Szczesny, and Kieran Gibbs has contributed to this, there’s another type of player contributing to it too.

Remember when I said the vast majority of players signed at under 18 were not for the first team, and hadn’t made their debuts yet? There are exceptions. Arsenal have had 4 in recent seasons- Gael Clichy, who already had minutes at Monaco, Theo Walcott and Alex Oxlade-Chamberlain from Southampton, and Aaron Ramsey from Cardiff.

Manchester United’s Lee Sharpe had already played for Torquay, whilst Jamie Redknapp, Ronnie Whelan, and Steve Harkness had all featured for other clubs prior to joining Liverpool. How do these graphs look after excluding these players?

Screen Shot 2014-09-07 at 10.13.17 (2)With the average recalculated to exclude these players, United are still the leaders. Predictably, Arsenal are the ones who suffer.

So, how good is United’s academy?

Even after the influence of the Class of ’92 began to fade, Manchester United were still giving significant minutes to academy players such as John O’Shea, Wes Brown, Rafael, Jonny Evans, Darren Fletcher, Tom Cleverley, Danny Welbeck, and Adnan Januzaj. Whether this approach will continue remains to be seen (you somewhat sense Louis van Gaal’s selection of players such as Tyler Blackett is reluctant at this point), but I was certainly wrong in my initial opinion. This, of course, does not account for academy players who have gone on to have successful careers either in the Premier League, Championship, or abroad, such as Ryan Shawcross, Danny Higginbotham, David Healy, Kieran Richardson, Guiseppe Rossi, Paul Pogba, Frazier Campbell, Danny Simpson, and dozens more. This article suggests United have made around £140 million from academy sales alone. Considering many of these players move for big fees before making their debut for United, that’s a pretty glowing endorsement.

Follow One Man Club on Twitter

A timeline of post-war Arsenal players

In the same vein as the post-war England timeline I put together last week, I’ve done the same thing for Arsenal players. These graphics feature every player with 100 or more appearances for Arsenal. Some of the early players on these timelines accumulated their appearances pre-war, but are included if they made appearances after 1945. Appearances/goals figures count all competitive matches. I’ve also included information on nationality, and a smaller manager timeline at the top. All figures are split by position. Enjoy!

gkdefmidfinal

forwards

Follow One Man Club on Twitter
On the Consistency and Longevity of Miroslav Klose

Many seem to have decided Miroslav Klose’s new status as the top scorer at World Cup finals is some kind of travesty. Scoring against Brazil in the semi finals, Klose overtook Ronaldo to take the record, and reacted in typically humble fashion, declaring after the match “I’m a striker and strikers want to score goals.”

Few would mention Klose and Ronaldo in the same breath, but this doesn’t mean there is nothing to say for one of the most consistent players at international level over the past decade. Klose has featured prominently for Germany at 4 World Cups, in an international career thus far spanning 13 years. There are just two European players in history with more international goals (Sander Kocsis and Ferenc Puskas, both for Hungary), and Klose sits joint 8th in the list of top international goalscorers of all time. The figure below shows how Klose’s goal total has developed since his first cap in 2001.

klosegoalsKlose’s record has hovered around a goal every other game for Germany over the course of his international career, and his record is all about consistency. He had 15 goals at 30 caps, 29 goals at 60 caps, and 52 goals after 100 caps. Between 2002 and 2004, Klose went through a period where he scored just 3 in 27, but between 2006 and 2012 his longest goal drought was just four matches. That’s pretty impressive, especially for a forward going into their 30’s.

Klose broke Gerd Muller’s record of 68 goals just prior to the World Cup in Brazil, albeit in double the number of appearances. Klose sits sixth in goals-per-game ratio for Germany, behind Muller, Uwe Seeler, Fritz Walter, Oliver Bierhoff, and Rudi Voller. Here are all 6: strikersgermGerd Muller’s line is absurdly steep- 68 goals in 62 caps; international strikers do not score like this anymore. Klose’s longevity and consistency has been key in reaching the record, and he has achieved nearly 50 more caps than any of the others here.

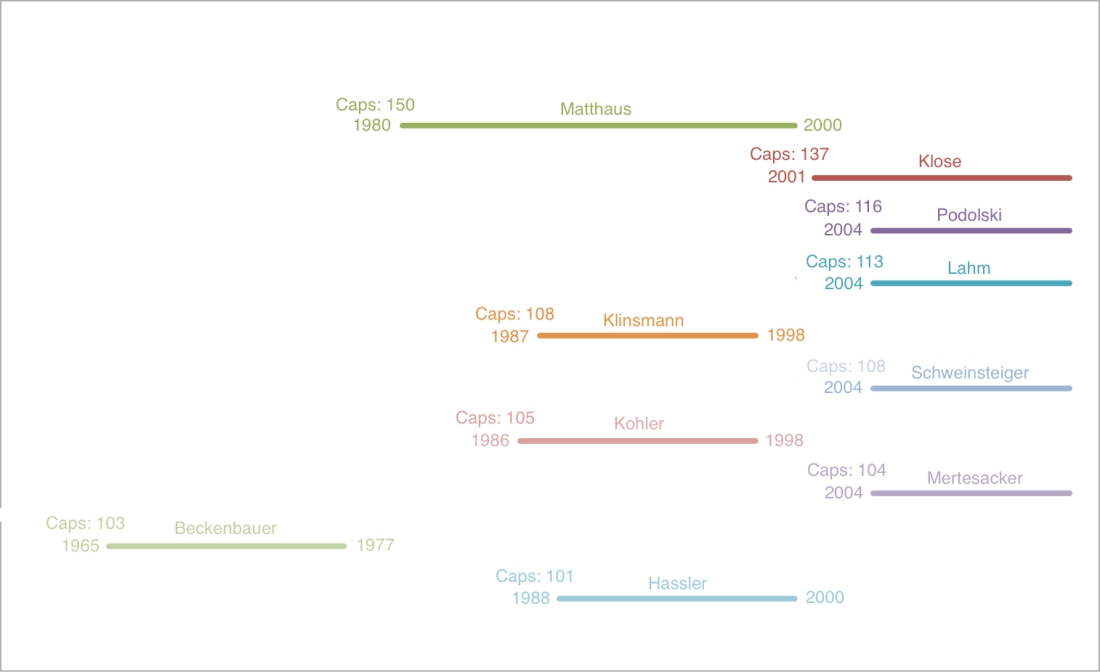
In fact, Klose is 2nd in Germany’s all time appearance list, behind only Lothar Matthaus, and his international career has spanned more years than the likes of Franz Beckenbauer, Jurgen Klinsmann, Michael Ballack, and Oliver Kahn. The figure below shows the span of his international career compared to the rest of the top 10 capped players for Germany.

germanyspanPeople will continue to knock him, but staying this consistent at international level into your 30’s is genuinely very special, even if your nickname isn’t El Fenomeno.

Follow One Man Club on Twitter

Wayne Rooney’s Goal Scoring for England

Wayne Rooney has arguably been England’s figurehead since at least 2006. Breaking through in the run up to Euro 2004, an 18-year-old Rooney was highly impressive at the tournament itself, and has fulfilled the hype at club level in the years since. For England, however, Rooney has often been a maligned figure, and following the poor showing at this World Cup, many are advocating a reduced role.

His goals by game record is pretty good, as shown below:

rooney2Rooney has managed 40 goals in 95 matches (0.5 goals per 90) for the national team. Considering England play difficult opposition regularly, both in qualifiers and friendlies, its a pretty good record. Its also worth pointing out Rooney does not always complete full matches- he’s completed 90 minutes just 38 times in his 90 caps.

He’s closing in on Bobby Charlton’s record of 49 goals for England, although will certainly need to win more caps than Charlton managed (106).

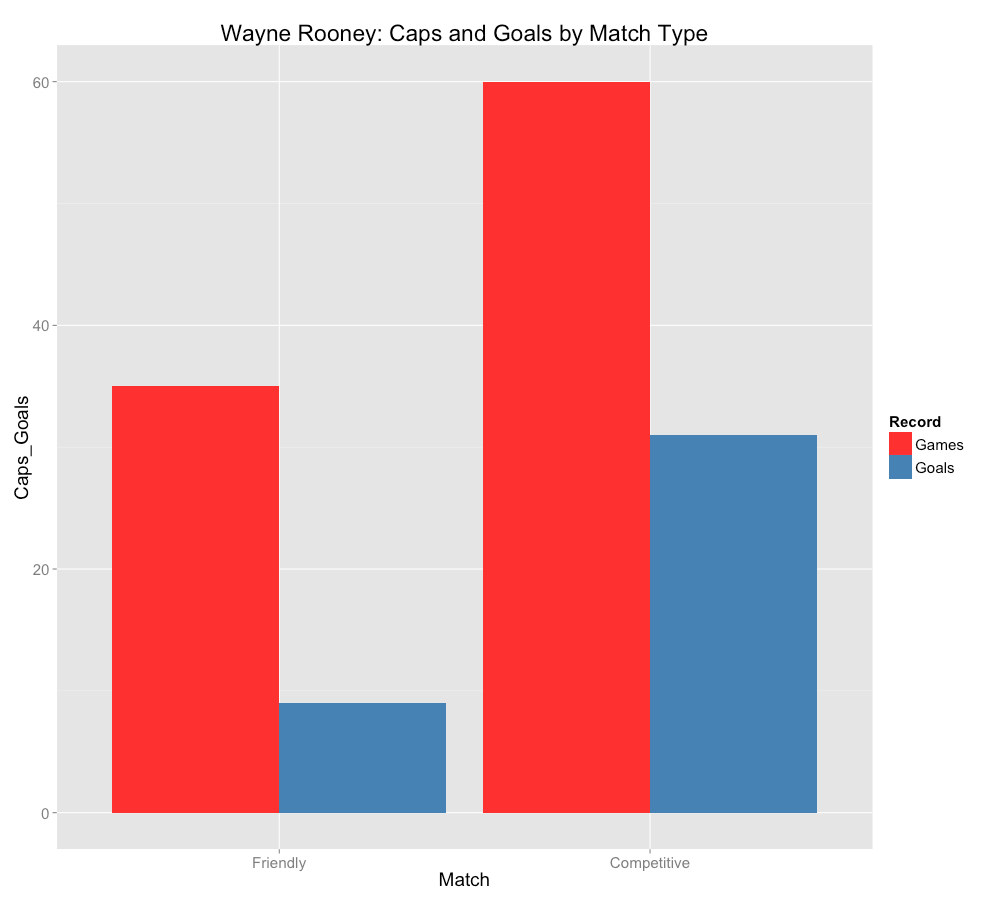
RooneyRooney’s record in competitive matches is far more impressive than in friendlies.

rooneyRooney has 31 goals in 60 competitive matches (0.61 goals per 90), and just 9 in 35 friendlies (0.31 goals per 90). His poor record in friendlies is probably due to a wider variety of personnel, different tactics, and reduced minutes, but its worth pointing out that his record in competitive matches is excellent.

He has 16 goals in 22 World Cup qualifying matches, even if his performance at these tournaments has been poor in terms of goal-scoring (World Cup matches between the red lines below).RooneytournSo, should Rooney be dropped? As someone who is at this point unsure on whether Daniel Sturridge should be the long-term replacement option, I’d be a little reluctant. Arguments about style of play aside, he has a great scoring rate, especially in competitive matches. That said, Rooney is getting older, and his fitness has always been in question. In my opinion, England shouldn’t give up on him just yet.

Follow One Man Club on Twitter

Cristiano Ronaldo’s Goal Record for Portugal

The graph below shows how Cristiano Ronaldo’s goal record has developed over time for Portugal.

c.ron

Ronaldo broke Eusebio’s goal record for Portugal against Northern Ireland in September last year, and became Portugal’s all time top scorer when he broke Pauleta’s record of 47 goals just prior to this World Cup.

eusebio

Eusebio’s 41 goals were scored over a much smaller number of appearances, and Ronaldo has been used as a wide forward in the past, meaning their totals develop somewhat differently.

One of the first things I noticed about Ronaldo’s numbers is that slump in goals between his 50th and 75th cap. I wondered if this coincided with anything, so looked first at managerial changes.

c.ronmanager

The dashed lines represent the tenure of Carlos Quieroz (between Ronaldo’s 59th and 77th cap). Ronaldo only scored 3 goals under Quieroz’s management, although this slump does seem to begin in the final matches under Luis Felipe Scolari. He also received less playing time, appearing in just 18 matches out of a possible 49 under Quieroz. Since Paulo Bento’s appointment in 2010, Ronaldo has surged to Eusebio’s record with 27 goals in 37 games.

Finally, how does his form coincide with major tournaments?

cronworldcup

Ronaldo has scored 6 goals at European Championships, but has just 3 World Cup goals (indicated by red lines). This is a little surprising given Portugal’s good showings in 2006/2010.


Neymar vs Pele and Ronaldo for Brazil

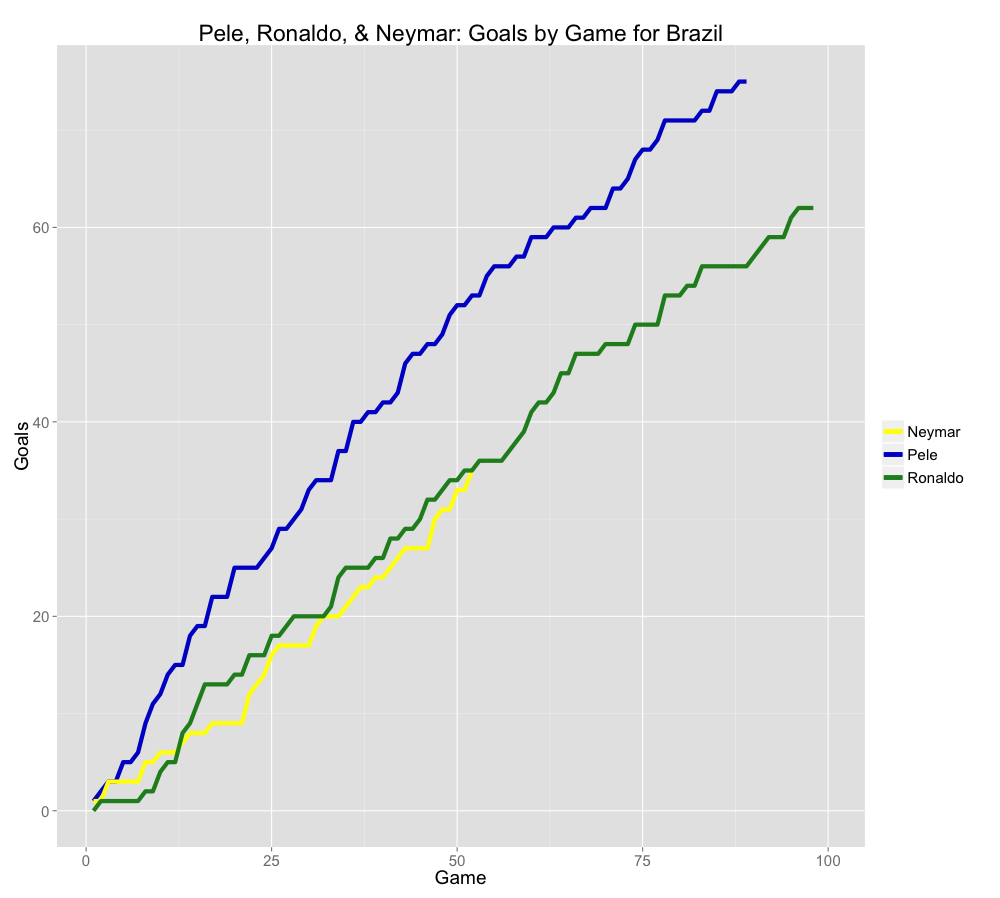
Following on from yesterday’s piece on Neymar and his burgeoning goal tally for Brazil, I wanted to take a look at how he compares to the top 2 goalscorers in Brazil’s history- Pele (92 caps, 77 goals) and Ronaldo (98 caps, 62 goals).

Rplot

Pele’s line is remarkably steep- between his 8th and 53rd appearances- a period of 8 years, he had more goals than caps. After that, he levelled off a little, before having a boost right at the end of his Brazil career, with 6 goals in his final 10 caps.

At no point did Ronaldo have more goals than caps, and he started a little slower than both Pele and Neymar, but scored 22 goals between his 10th and 40th caps, and a further 22 goals between his 40th and 70th caps.

Barring a incredibly rise in his scoring rate for Brazil, Neymar will not catch Pele in the same number of appearances- he would have to score 42 goals in his next 40 games for Brazil to reach 77 goals in 92 caps. If he continues scoring at 0.7 goals per 90 minutes, he will reach 77 goals somewhere around his 120th cap, but considering Neymar’s age its hardly impossible that his scoring rate will continue to increase.

One cool stat to come out of this- if you look closely at the graph, you’ll see that right now Neymar and Ronaldo’s lines are at precisely the same point. This is because at 52 caps, Ronaldo had 35 goals- the exact same record as Neymar. To add to this, Ronaldo was 22 when he picked up his 52nd cap. Neymar is also 22.